Veeam Performance Optimisations

I visited the VeeamON forum a couple of weeks ago and wrote a post on Veeam Version 10 what’s new. One of the other interesting sessions at the event was a presentation on best practices to ensure Veeam Performance Optimisation. I made some notes during the session that I wanted to share to help you get the best performance from Veeam.

Choose the correct backup mode

Forward incremental was recommended as the best general backup mode. In this mode an initial full is created with the first backup, then incrementals for all future backups after this time.

Reverse incremental were recommended for long backup chains, but since the most recent backup point is always a full created by injecting the changed blocks this is an I/O intensive process and slower versus forward incremental.

I have found that jobs which suffer from slow merge times can be improved by scheduling an Active Full. Whilst clearly the Active Full will take some time the incremental backups will no longer require a merge and be much quicker.

Transport Mode

Within the proxy server settings you have a choice of several different transport modes which determine how the data is copied. They are listed below in order of speed from fastest to slowest.

Direct storage access – This mode requires a physical or virtual proxy server, which has direct access to the production data via software or hardware HBA. Although a VM can be used, using a physical server is highly recommended. This is the fastest option allowing all backup data to be transported directly across the SAN

Virtual appliance – This method requires a VM running the proxy role. The VM proxy hot adds the disks that need backing up enabling data to go directly from the datastore eliminating the network

Network – This is the least restrictive method and requires no additional setup or infrastructure. Like in a traditional backup data is copied across the LAN. Although this has generally been considered the slowest, 10Gb is changing this

Transport mode selection screen from Veeam

Repository

Consider the performance characteristics of the storage you are using for your repository. RAID choices were mentioned, if you are using a modern storage system things are not going to be so simplistic as changing RAID types to improve performance. My take home from this point was just make sure your particular storage is optimally configured.

Also be sure to check out this Webinar I did with Veeam covering optimising 3PAR performance.

Proxy Affinity

Allows you to assign backup proxies to specific repositories. This could be useful to ensure the proxy in the correct geographic location is used or to ensure proxies with the best connection speed to a repository are utilised. This is set by right clicking a backup repository and choosing proxy affinity.
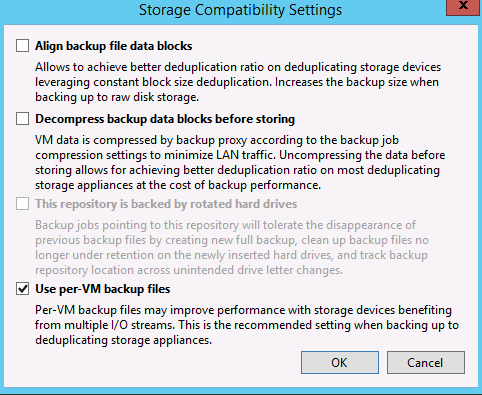
Setting the proxy affinity at the repository level

Per VM backup files

Prior to Veeam version 9 a single backup file was created for all the VM’s in a job when creating a recovery point. Per VM backups chains, means that each VM in a job creates its own backup chain. The positive impact of this is that more writes can be processed in parallel allowing for greater throughput. This feature is enabled at the repository level within the advanced repository settings.

Changing a Veeam backup chain to use per-vm backup files

Parallel Processing

Enables multiple backup tasks to be completed simultaneously rather than waiting for serial processing, again this allows greater throughput. This is enabled by default and set in general options

Options screen to enable parallell processing and storage latency control

Backup I/O control

This may seem counterintuitive to limit the storage repository but once any storage device becomes over busy and writes start to queue performance can degrade exponentially. By limiting the throughput in cases where high latency has been seen, it may in fact allow writes to be committed in a more timely fashion. This is set in general options and can be seen in the screenshot above in which you set a latency threshold in ms above which the setting kicks in.

Hyper-V RCT (Resilient Change Tracking)

Veeam is able to use Hyper-V native CBT Resilient Changed Tracking if the following criteria are met:

  • All hosts are Hyper-V Server 2016 in cluster
  • Cluster functional level is 2016
  • VM config is version 8

ReFS

Which stands for Resilient File System is the name for the new Windows file system introduced with Windows Server 2016. When integrated with Veeam it offers the opportunity to significantly reduce the time backups take. Synthetic full backups and the Veeam transform process require a significant amount of moving blocks around to create the backup file. This is an I/O intensive process and takes time to complete, relative to the performance of the underlying storage. When using ReFS the physical movement of blocks is no longer necessary, by harnessing the MS fast cloning capability pointers are simply updated.

If you want to learn more about Veeam be sure e sure to check out The VeeamON Virtual Tour. This is a free online event in which you can learn the latest information about data protection and specifically Veeam.


EVA Max Transfer Size

Another HP EVA Post from the vaults:

Recently I saw an issue where an EVA was delivering poor performance when under load from a full backup. I used EVAPerf to investigate the issue and found that the disks were not under pressure, however the CPU was running up to 100% busy. During these spikes of high CPU usage the latency on the LUNS was inevitably very high.


I found the following advisory from HP, which describes performance issues which are created by the MAX IO limitations of the EVA. THE EVA was designed to deal with a max IO size of 128KB, when receiving a transfer size larger than this it has to buffer it and then break it down, putting an increased load on the system. The suggestion from HP is to limit the max IO size from the host system. The hosts connected to the EVA in question were Windows 2008 R2, the method to limit the IO size was via the HBA.


The hosts I was working on were using Qlogic HBA’s. To make the changes to a Qlogic HBA you need to be on a driver version of 9.1.8.28 or later and then follow these steps from the Windows command line:

1 View current MAX IO size qlfc -tsize /fc

2 Set MAX IO size to 128KB qlfc -tsize /fc /set 128

3 Set as default qlfc -tsize /fc /set default


Since implementing the reduced block size the performance has returned to a good level.

STOR2RRD – Free Storage Performance Monitoring Software

Having worked in storage for some years I know one of the key challenges especially in larger environments is managing systems from multiple different vendors. Most companies end up in the same situation, with changing purchasing policies and objectives over the years resulting in having storage systems from a number of different Vendors. Monitoring all your different systems and keeping track of their performance and health can be a challenge, since each vendor has its own set of tools.

This is where Xorux is aiming to help administrators with a single product, STOR2RRD. By using STOR2RRD you can get a single web based interface that allows you to view the performance of all your different systems. Check out the graphic below, which displays a significant number of different storage systems being monitored by a single STOR2RRD server.

If you want to see if your storage system is supported you can read the full list of supported storage systems, the list of systems is significant and includes both storage systems and switches.

Deployment

The traditional deployment model for STOR2RRD is a web server and application server both on a Linux or Unix OS. If you are allergic to black and white do not fear as a simple deployment method is available in the form of an appliance. The appliance comes in Hyper-V and VMware flavours and handily contains the webserver and application components i.e. you only need to deploy one appliance. The product is open source and distributed for free download . Also available is a SAAS hosted version of the product.

Adding in Storage Systems

Once you have completed the deployment you can then add in the storage system you need to monitor. The method to add in your storage system varies by Vendor. I will run through adding a 3PAR at a high level as an example:

  • Create read only account on 3PAR
  • Add storage system to the STOR2RRD application config
  • Create SSH key pair using ssh-keygen utility

What do I get

Great so you have gone to the effort to deploy it, now what? The dashboard view again gives you a good feel for the fact you can monitor a large number of products from one place.

If you want to take to take the product for a hands on spin you can have a look at this interactive online demo

3PAR Stuff

Given that many 3PAR owners frequent this blog I wanted to give a demo of some of the charts available for the 3PAR system.

The following charts show the cache performance for the system. You access the performance monitoring via a web browser. The interface is tabbed so I am looking at the read tab in these screenshots but there is also a write tab. It also shows multiple time frames in a single window, so you can spot trends. In the below screenshot for instance we are looking at the time frames last day, week, month and year

Port stats are similar you see a view with multiple time frames, I have just chosen to zoom in on the last days stats. You see the aggregated IO patterns plus a table showing the busiest ports.

It’s a similar story for volumes you can see IO and response time stats for a range of time frames. What is nice is that you can also chose top to see the busiest volumes, you can sort the order on a range of different measures including IO/throughput and response time. I am looking at the daily view but you will see the top stats are available for a range of time frames from daily to weekly.

If you are interested you can download a fee copy of STOR2RRD.