
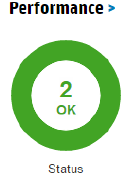
Threshold Alerts is one of my favourite new features in SSMC and allows alerts to be configured based on defined metrics. These alerts can be defined against logical components such as virtual volumes or physical components such as disks. An alert is triggered when a defined threshold is exceeded, for example you may choose to alert when ports are over 75% busy. Threshold Alerts are integrated with the service processer and will trigger an e-mail being sent. You will see triggered alerts within SSMC from the dashboard view, the below screenshot shows 2 systems with no active alerts if an alert was triggered the donut would turn yellow.
To make setting up Threshold Alerts easier they can be configured through pre-defined templates. Different templates exist for different components and each one can be customised as required. To use threshold alerts the system must be licenced for System Reporter.
To configure a Threshold Alert you need to complete the following steps within SSMC:
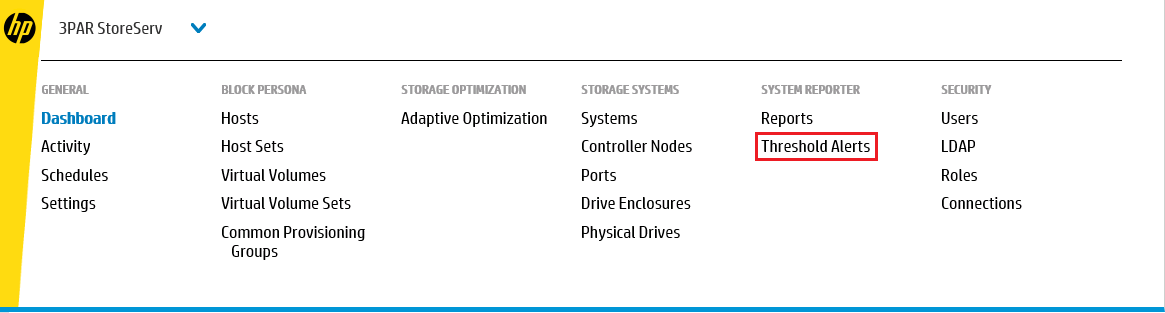
1 Select from the Main Menu Threshold Alerts
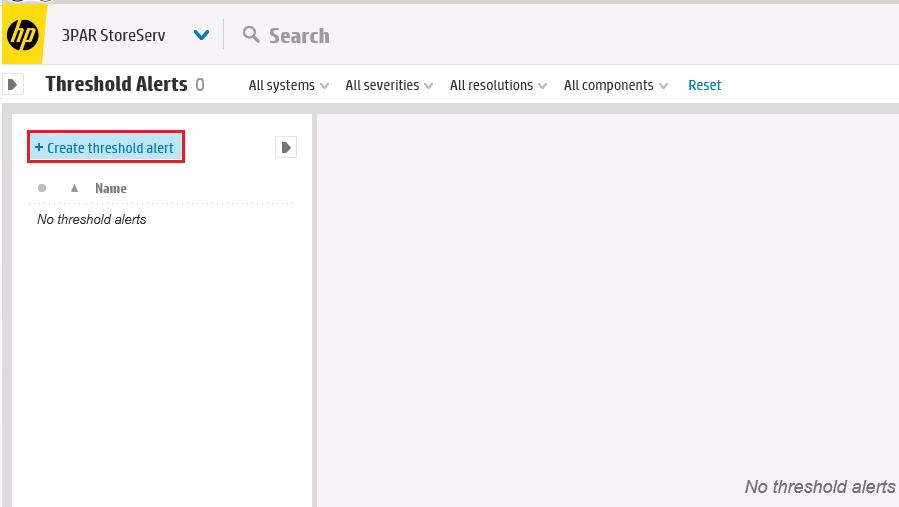
2 Select the Create threshold alert button
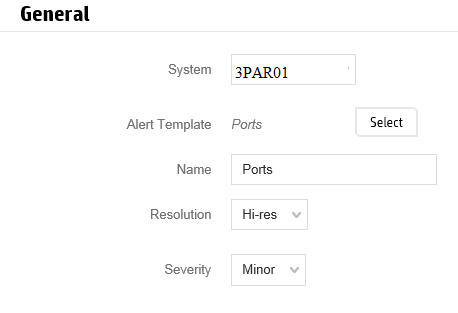
3 In the general section select the system and choose the alert template. Below shows an example of the alerts types you can work with they include ports, disks, nodes plus logical objects such as VV’s and priority optimization.

You will also need to choose the alerting level resolution which is how often the data will be sampled to see if the alert has been triggered. Remember choosing a higher resolution may result in more alerts being generated when there are spikes, to ensure the alert condition is sustained choose a longer sample time. Choose the severity you would like to associate with the alert you are configuring.
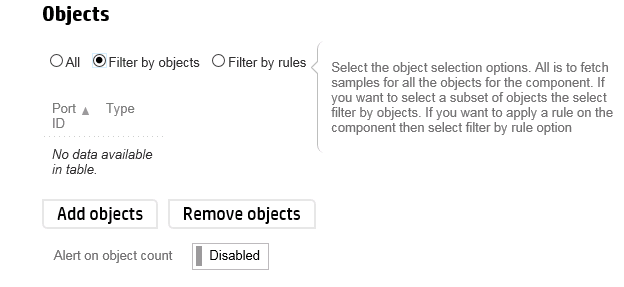
4 In the objects section you can filter against which objects alerts are generated. If for example you only want to monitor certain ports or VV’s this is where you can narrow them down by selecting filter by objects radio button and then clicking add objects button.
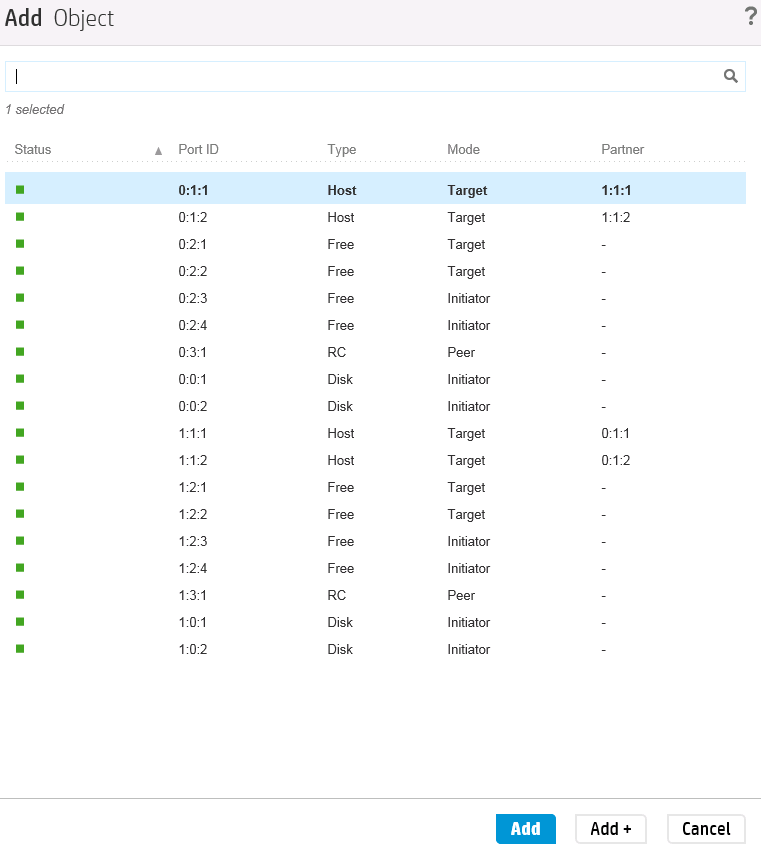
The screenshot below show an example of objects you can filter on when creating a port alert.
5 Finally chose the metric you wish to measure on.
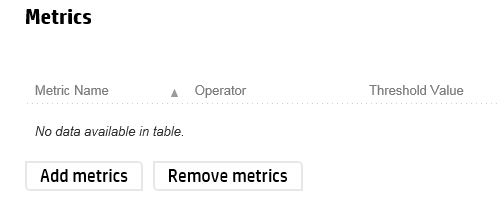
The following screenshot is again for the port objects, you can chose to measure on metrics such as % busy, bandwidth and service time.
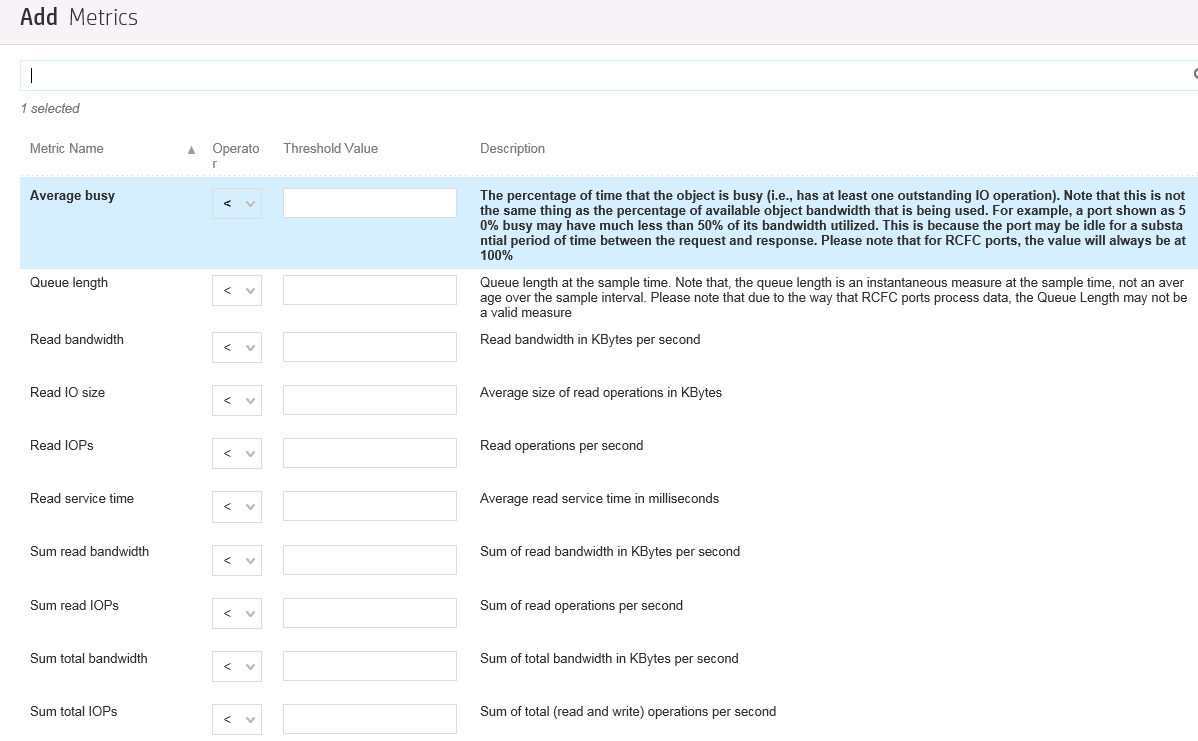
Metrics can be combined so that multiple conditions must be met. For example the following alert will only trigger if service time is over 40ms and IOPs are greater than 1000.

Up to 64 alerts can be configured and it’s worth noting the alert will be centrally monitored by HP and could trigger support cases. Alerts can also be configured via the CLI using the command createsralertcrit, more on this another time.
If you missed any of my other posts introducing SSMC don’t forget to check them out:
The SSMC Administrator Console
Newbies Guide to The 3PAR SSMC