
How much free capacity has my 3PAR got? This seems like a simple question but I see lots of questions about it. The SSMC has simplified viewing the 3PAR capacity information significantly so lets start there .
SSMC
Raw Capacity
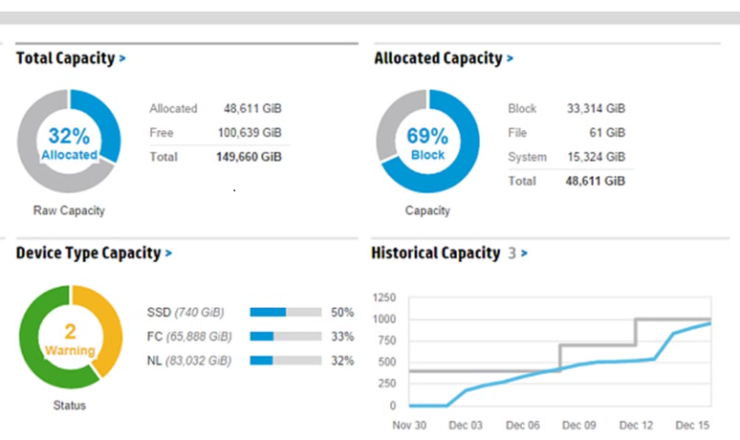
When you open the 3 PAR SSMC you will see the dashboard view. In the dashboard you will see a number of widgets that will help you with your 3PAR capacity management, the widgets are as follows:
Total capacity – This shows you the total raw capacity. For clarity this raw capacity is just the sum of the capacity of all the disks in your system and takes no account of RAID levels, sparing etc.
Device Type Capacity – This again measures raw space but this view allows you to see it by device type i.e. the type of disk be that FC, NL or SSD
Allocated capacity – Another raw figure, this takes the total capacity allocated which means used and shows you what it is using up the space dividing it up by block, file and system The above widgets show the capacity for ALL systems connected to SSMC, to see the capacity information for a single system click on the widget in the dashboard. You can also drill down to the capacity for a single system by opening the main menu, and then choosing systems, then choosing the capacity view.
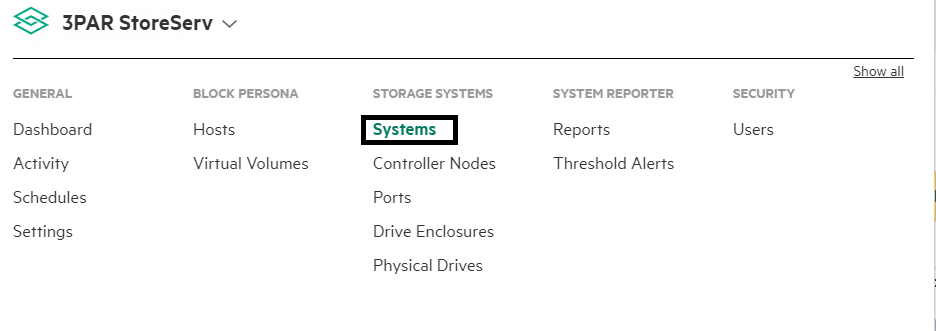
Useable Capacity
The capacity measures we have looked at so far have shown raw space available in different ways. Potentially the figure you will be most interested in will be how much space is actually available to be written to i.e. what is the useable space. For this we need to look at the CPG level
From the main menu choose Common Provisioning Groups. If you cannot see this option choose show more from the top right
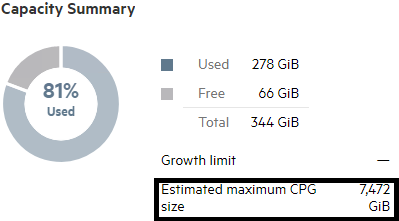
In the left hand pane choose the CPG you are interested in checking the available space for. In the right hand window look at the Capacity Summary widget. When you look at this you will probably look at the free figure and see there is not much space left. Once you finish nearly having a heart attack thinking you are about to run out of space, let me reassure you that this figure is highly misleading. CPG’s grow on demand and this figure will always show a small amount of free space.
The figure you are really interested in is the Estimated maximum CPG size. This is the figure that shows the useable capacity available to the 3PAR. Be mindful that multiple CPG’s can consume space from the same set of physical disks, check out our CPG Overview if you need a refresher on this
Command Line
If you are a command line junkie you can get exactly the same stats from the CLI. To view get a similar view of disk capacity utilisation as in part 1 run
showsys – space
To view writeable capacity left on a CPG as in part 2 run the below, the figure you are interested in is LD free
showspace -cpg cpgname

     -------------------------(MB)--------------------------

 CPG -----EstFree----- ------Usr------ ---Snp---- ---Adm----

 Name RawFree   LDFree   Total   Used Total Used Total Used

R6 15954816 10636544 2051840 2048000     0   0     0   0
3PAR Management Console
Raw Space
If you still use the 3PAR management console read on. The first thing to understand is how much capacity has been consumed on the physical disks. This is simply as a percentage how full are the disks. The steps to find this are below
- Open up your 3PAR Management Console
- Select systems from the navigation pane
- Highlight the name of your SAN in the management tree
- In the management window choose the capacity tab.
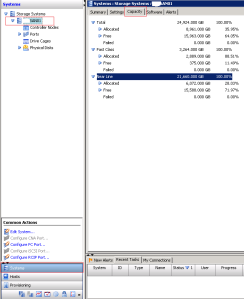
It’s quite self-explanatory. The top of the windows shows the total for all the different types of disks in your system and then breaks this down by disk type below, this is then further broken down into allocated and free space. So for example the above screen shot shows the fast class disks are 88.51% full.
Next you want to know what’s gobbling up all that space. If you expand the disk class you are interested in you will see it then splits this into space used by the system v space used by volumes

You can keep drilling down further and further on an item. Like below, I’m looking at what proportion of the allocated space is taken up by the volume itself and how much is snapshot space. Have a play and you will get the idea.

Ok so now we know how much space is left on our physical disks but the key question is how much actual writeable space is left for critical stuff like the marketing department to store their pictures in. You can view this on a per CPG level.
Useable Space
This part deals with the question how much writeable space have I got left in the CPG.
- Open up your 3Par Management Console
- Select provisioning from the navigation pane
- Then from the management tree highlight CPG’s
- In the management pane on the top right highlight the name of the CPG you want to look at
- Choose summary in the bottom management pane
- The stat you are interested in is estimated free system space, shown in the bottom management pane
 So the above screenshot shows that there is 10,387GiB of writeable space left on this CPG. Writeable space takes account of the amount of space consumed by raid parity, system space etc. and tells you how much space is actually available for volumes to grow into.
With the CPG space figures you need to be aware if you have other CPG’s on the same set of physical disks they will also be competing for the space. So for example in the above screenshot the 10,387GIB may not be for exclusive use by the CPG you are looking at. Also be aware that some CPG’s will consume space much faster than others, for example a raid 1 CPG will use up space much quicker than a raid 5 CPG.
Hopefully knowing these methods will allow you to manage the capacity of your 3PAR system more easily
To stay in touch with more 3PAR news and tips connect with me on LinkedIn and Twitter.