
How much free capacity has my 3PAR got? This seems like a simple question but I see lots of questions about it. The SSMC has simplified viewing the 3PAR capacity information significantly so lets start there .
SSMC
Raw Capacity
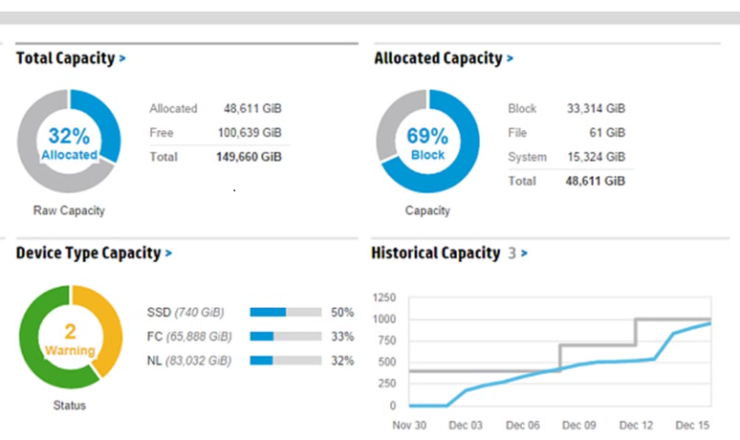
When you open the 3 PAR SSMC you will see the dashboard view. In the dashboard you will see a number of widgets that will help you with your 3PAR capacity management, the widgets are as follows:
Total capacity – This shows you the total raw capacity. For clarity this raw capacity is just the sum of the capacity of all the disks in your system and takes no account of RAID levels, sparing etc.
Device Type Capacity – This again measures raw space but this view allows you to see it by device type i.e. the type of disk be that FC, NL or SSD
Allocated capacity – Another raw figure, this takes the total capacity allocated which means used and shows you what it is using up the space dividing it up by block, file and system The above widgets show the capacity for ALL systems connected to SSMC, to see the capacity information for a single system click on the widget in the dashboard. You can also drill down to the capacity for a single system by opening the main menu, and then choosing systems, then choosing the capacity view.
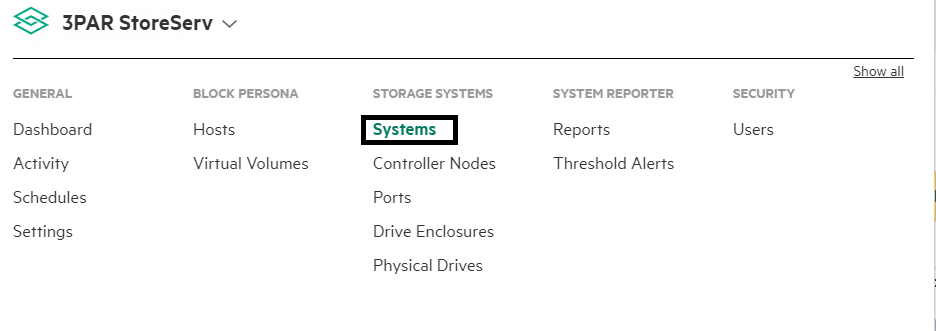
Useable Capacity
The capacity measures we have looked at so far have shown raw space available in different ways. Potentially the figure you will be most interested in will be how much space is actually available to be written to i.e. what is the useable space. For this we need to look at the CPG level
From the main menu choose Common Provisioning Groups. If you cannot see this option choose show more from the top right
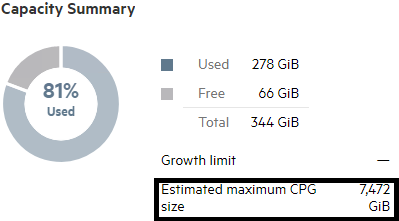
In the left hand pane choose the CPG you are interested in checking the available space for. In the right hand window look at the Capacity Summary widget. When you look at this you will probably look at the free figure and see there is not much space left. Once you finish nearly having a heart attack thinking you are about to run out of space, let me reassure you that this figure is highly misleading. CPG’s grow on demand and this figure will always show a small amount of free space.
The figure you are really interested in is the Estimated maximum CPG size. This is the figure that shows the useable capacity available to the 3PAR. Be mindful that multiple CPG’s can consume space from the same set of physical disks, check out our CPG Overview if you need a refresher on this
Command Line
If you are a command line junkie you can get exactly the same stats from the CLI. To view get a similar view of disk capacity utilisation as in part 1 run
showsys – space
To view writeable capacity left on a CPG as in part 2 run the below, the figure you are interested in is LD free
showspace -cpg cpgname

     -------------------------(MB)--------------------------

 CPG -----EstFree----- ------Usr------ ---Snp---- ---Adm----

 Name RawFree   LDFree   Total   Used Total Used Total Used

R6 15954816 10636544 2051840 2048000     0   0     0   0
3PAR Management Console
Raw Space
If you still use the 3PAR management console read on. The first thing to understand is how much capacity has been consumed on the physical disks. This is simply as a percentage how full are the disks. The steps to find this are below
- Open up your 3PAR Management Console
- Select systems from the navigation pane
- Highlight the name of your SAN in the management tree
- In the management window choose the capacity tab.
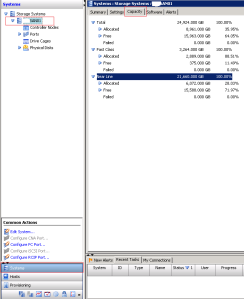
It’s quite self-explanatory. The top of the windows shows the total for all the different types of disks in your system and then breaks this down by disk type below, this is then further broken down into allocated and free space. So for example the above screen shot shows the fast class disks are 88.51% full.
Next you want to know what’s gobbling up all that space. If you expand the disk class you are interested in you will see it then splits this into space used by the system v space used by volumes

You can keep drilling down further and further on an item. Like below, I’m looking at what proportion of the allocated space is taken up by the volume itself and how much is snapshot space. Have a play and you will get the idea.

Ok so now we know how much space is left on our physical disks but the key question is how much actual writeable space is left for critical stuff like the marketing department to store their pictures in. You can view this on a per CPG level.
Useable Space
This part deals with the question how much writeable space have I got left in the CPG.
- Open up your 3Par Management Console
- Select provisioning from the navigation pane
- Then from the management tree highlight CPG’s
- In the management pane on the top right highlight the name of the CPG you want to look at
- Choose summary in the bottom management pane
- The stat you are interested in is estimated free system space, shown in the bottom management pane
 So the above screenshot shows that there is 10,387GiB of writeable space left on this CPG. Writeable space takes account of the amount of space consumed by raid parity, system space etc. and tells you how much space is actually available for volumes to grow into.
With the CPG space figures you need to be aware if you have other CPG’s on the same set of physical disks they will also be competing for the space. So for example in the above screenshot the 10,387GIB may not be for exclusive use by the CPG you are looking at. Also be aware that some CPG’s will consume space much faster than others, for example a raid 1 CPG will use up space much quicker than a raid 5 CPG.
Hopefully knowing these methods will allow you to manage the capacity of your 3PAR system more easily
To stay in touch with more 3PAR news and tips connect with me on LinkedIn and Twitter.
As a storage admin, I am a big fan of 3Pars. This said, I must confess that guessing free space is tricky as hell, specially on thin provisioned environments.
Hi, great articles and easy to understand. I was hoping you may have information on the ‘CPG Growth Warning’ for AO? I am having a difficult time understanding if the CPG Growth warning should use the ‘CPG logical disk size’ or the ‘physical raw disk size’. The CPG size is much smaller to account for the RAID 6. Thank you in advance.
Hi thanks for the feedback.
As this alert relates to the CPG you would use the CPG space. Have a look what the total useable space is for the CPG and then set the warning as a proportion of this.
Hi, thank you for your reply. The total usable space for the CPG is that the ‘Allocated Space’ value directly below the ‘CPG Growth Warning’ on the image of the CPG Details?
Just wanted to confirm I am checking the correct value for ‘total CPG space’.
Allocated capacity = includes usable space, snap space, admin space( raid protection)
reserved space = includes spare chucklets?
system space=?
Hello, Could you explain for me about this “.CPG displays full in allocated percentage as the picture above, but the capacity in OS is not”
I assume you mean Virtual Volumes. This is because pre server 2012 when data was deleted it did not actively pass back the message to the SAN that data had been deleted. You needed to use utilities like sdelete to force the write of zeros.
What happen if you do not run unmap or sdelete on LUN at host end and delete that LUN from 3par after unexporting that volume, will 3par be able to reclaim that space back to system?
No need to run any kind of space reclaim command like sdelete. Once you delete the LUN space will be returned to the CPG. If you want to return the space to the whole system you would run a compactcpg after that
Thanks for the article. This has been helpful. Since you correctly assumed I’d freak out about free space, I wanted to make sure I understood exactly.
Here’s what I saw yesterday:
Dashboard:
– Total Capacity: Allocated 51TB, Free: 7.4TB, Total 58.5TB
– Allocated Capacity: Block 47.7TB, System: 3.3TB, Total: 51TB
CPG:
Capacity Summary: Used 37.3TB, free 1.9TB, Allocated 39.2TB
I then deleted multiple VMs, ran the unmap command on all of my VMware datastores and, after that was done, ran a compactCPG.
Now, I see the following:
Dashboard:
– Total Capacity: Allocated 48.2TB, Free: 10.2TB, Total 58.5TB
– Allocated Capacity: Block 45TB, System: 3.3TB, Total: 48.3TB
CPG:
Capacity Summary: Used 37.5TB, free 111GB, Allocated 37.6TB
If I understand things correctly, because I ran unmap and then compacted my CPG, THAT is why my free space is frighteningly small. But, the important piece is that my total free capacity is 10.2TB so I really have 17% free space that my CPG can/will use to auto-grow.
Is that correct? I can breathe and rest easy knowing I have 10.2TB of growth left on my CPG?
Hi
It sounds like you ran the correct process and allocated has gone done and free has gone up which is positive. The scary free 111GB is the amount of space left in the CPG before it auto grows again, nothing to worry about. The 10.2TB you now have free is raw capacity. For the useable capacity look at the Estimated maximum CPG size, in Capacity Summary
Hope that helps
Richard
Hi,
If I enter showvv -space, I get a big difference between reserved usersapce and Used user space. Volumes does not appear to release space to CPG over time. Is this something you have encountered?
Regards
Mats
Hi Mats
Yes, The 3PAR will only release free space back if the OS of the connected host instructs it to do so. This only happened natively starting with vSphere 6.5 and Server 2012. Prior to this you will need to run unmap and sdelete manually.
Hi again,
connected OS in question is VMware. Unmap has been run and this is what has generated a lot of free space in VV’s, but no space is beeign returned to CPG as far as I can tell. 3Par OS is 3.2.2 MU3.
For Volumes in total
Rsvd Used
43810816 34268598
This is system volumes included where dds volume differs ~ 4 TiB in rsvd / used
Regards
Mats
Hi
Have you tried running a compactcpg?
Yes, gives nothing since there is no free space in CPG.
Hi Rich
I have a bigger confusion on below point .
“Allocated capacity – Another raw figure, this takes the total capacity allocated which means used and shows you what it is using up the space dividing it up by block, file and system”
When you say USED, is it really used by the host or Is it what that we allocated to the server from SAN.
In our case below is the stats.
CPGS : FC_R6_S12 – Estimated capacity 108,464 GB
FC_R5_S6 – Estimated capacity 11905 GB
Total Capacity : Aloocated 93336 GB, Free 134328 GB, Total : 227664 GB
Allocated Capacity : BLOCK 82956 GB, System 10380 GB, Total 93336 GB (*** What exactly mean by this ????*****)
The Bigger Questios are
1) What is the Total Capacity allocated to the servers
2) What is the Actual used capacity by Host (Can we get this data)
Yes used is really used, data has been written to disk to use up the space.
Total Capacity allocated to the servers – This would be the total of virtual size fro the volumes
Actual used capacity by host – This would be the total of reserved user size for the volumes
Hello,
I’m looking at my CPG Capacity Summary. Used is 4,000 GiB, Free 27 GiB, Total is 4,100 GiB. Then it says the Estimated maximum CPG size is 3,000 GiB. How can the Maximum be less than the Total? Is it really meaning Estimated CPG size FREE? Or does it take in Capacity Efficiency into the equation at that point, in which I’m running about 1.6:1.
Estimated maximum means, useable capacity i.e. taking into account RAID, system space etc
Thanks for your reply Richard. But I am still a bit confused.
If my Total used = 4,100 GiB
How can Est. Max = 3,000 GiB
I am using more space than it thinks is available. Maybe I am not understanding something?
This is a misleading name to be honest. It means the amount of writeable space that you have left
You helped clear up lot of doubt related the different capacity nomenclature used on 3PAR. But I think whoever wrote the output of all these capacity commands could have used some help putting things from a user perspective and kept it simple instead of making it so complicated.
Thanks for all your Help
Thanks for the feedback, I agree, it could be simpler
[…] Viewing Free Capacity in 3Par […]